
Machine Learning / Data Visualization
Capstone Project
Understanding Climate Change’s Impact on the Forest Ecosystem: Developing a Reproducible Machine Learning Approach to Ecohydrologic Model Outputs.

Python / SQL
CPI SQLite Database
Simple SQLite database updated with GitHub Actions.

Time-Series / R Shiny
Stationarity in Time-Series Models
Interactive blog post with embedded R Shiny applications to visually explain the concept of stationarity in time-series models.

Machine Learning / Python
Predicting Home Prices Using XGBoost
Kaggle project including exploratory data analysis, feature engineering, and hyperparameter tuning for an XGBoost model, with predictions ranking in the 80th percentile of submissions (~4,000 entrants).
R Shiny / APIs
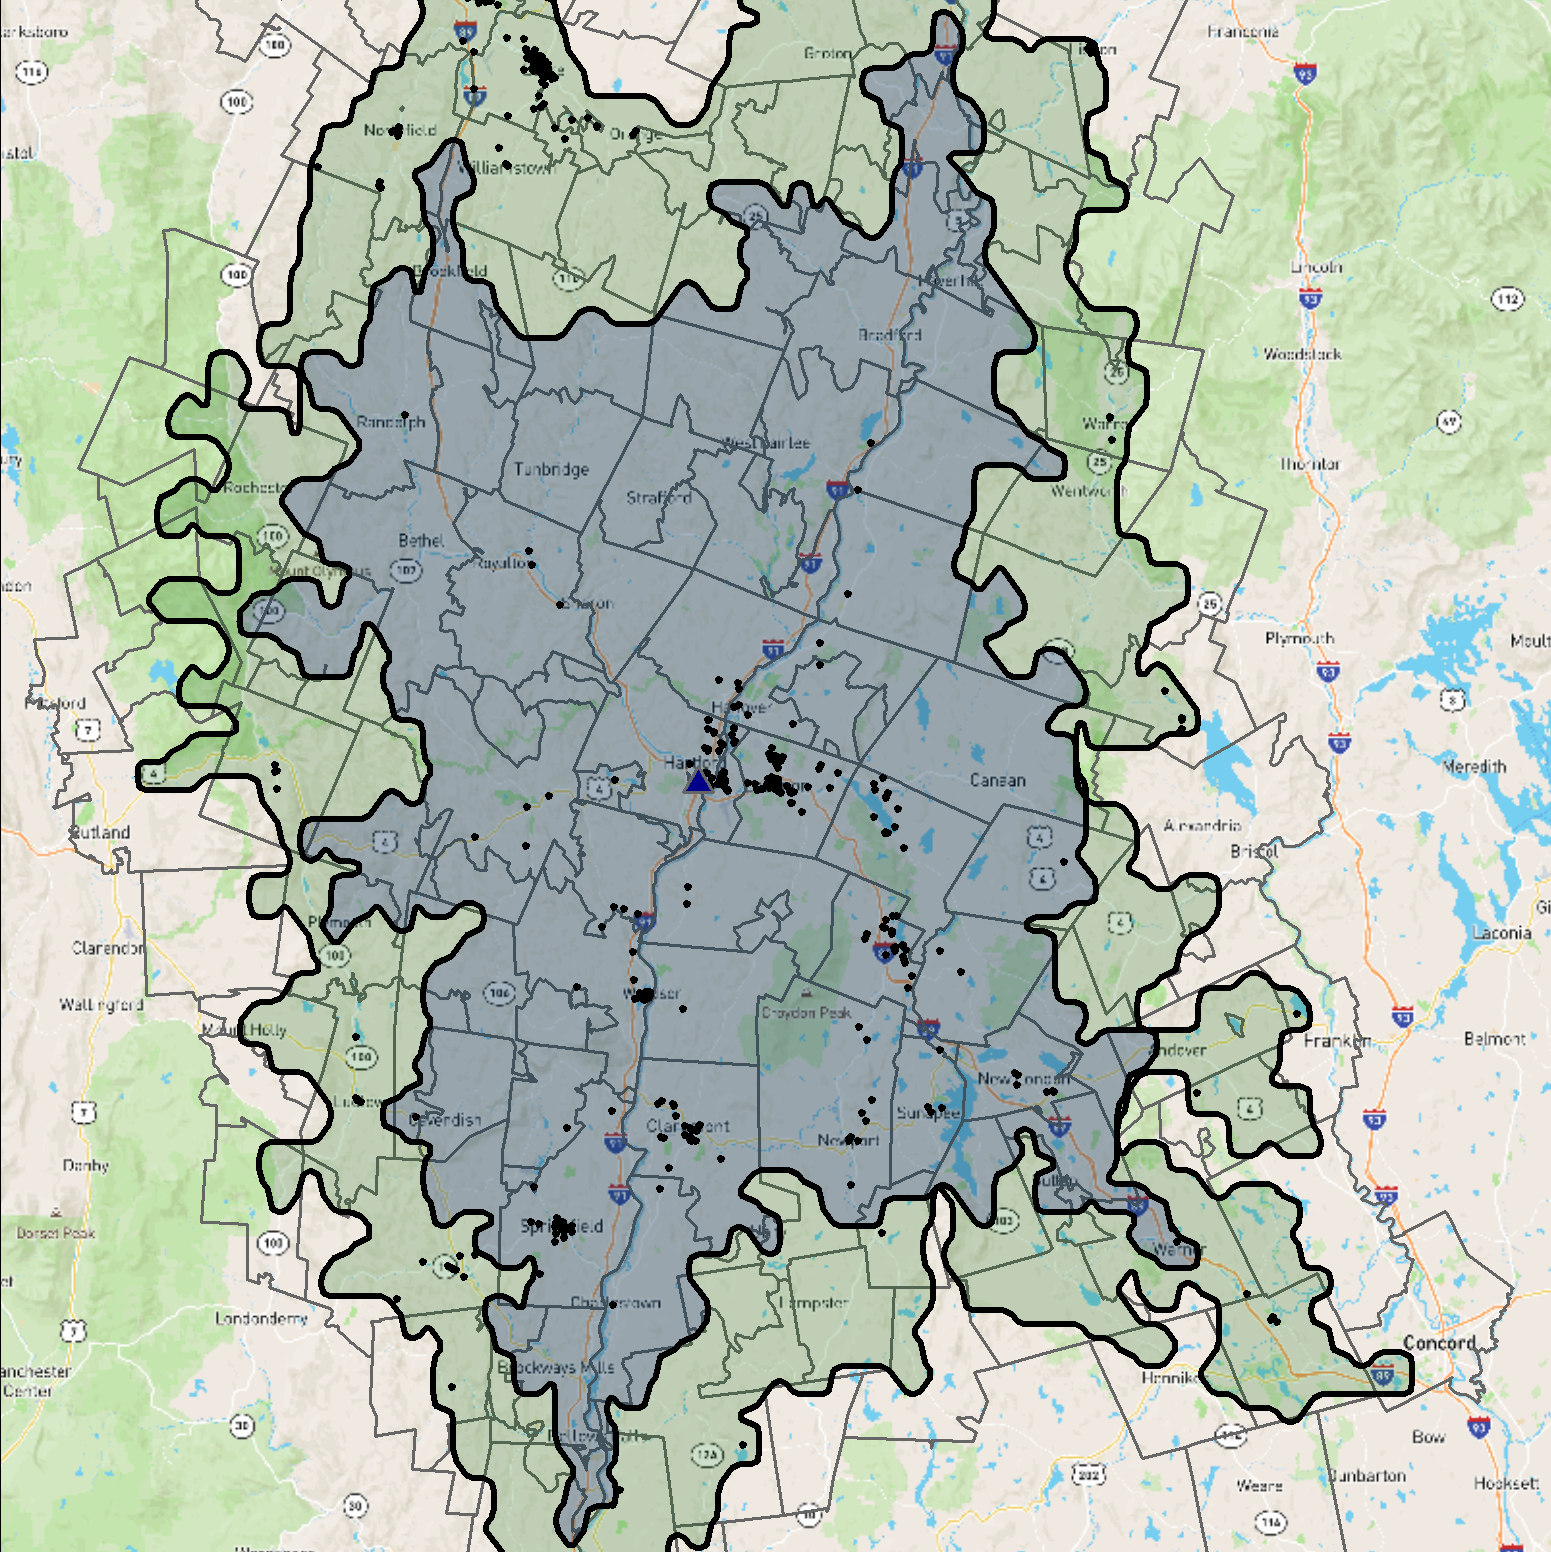
Market Area Creator Tool
Tool to interactively create, view, and download market areas (all destinations that can be reached in a specific amount of time or distance) using the HERE API.
Data Visualization / Cartography
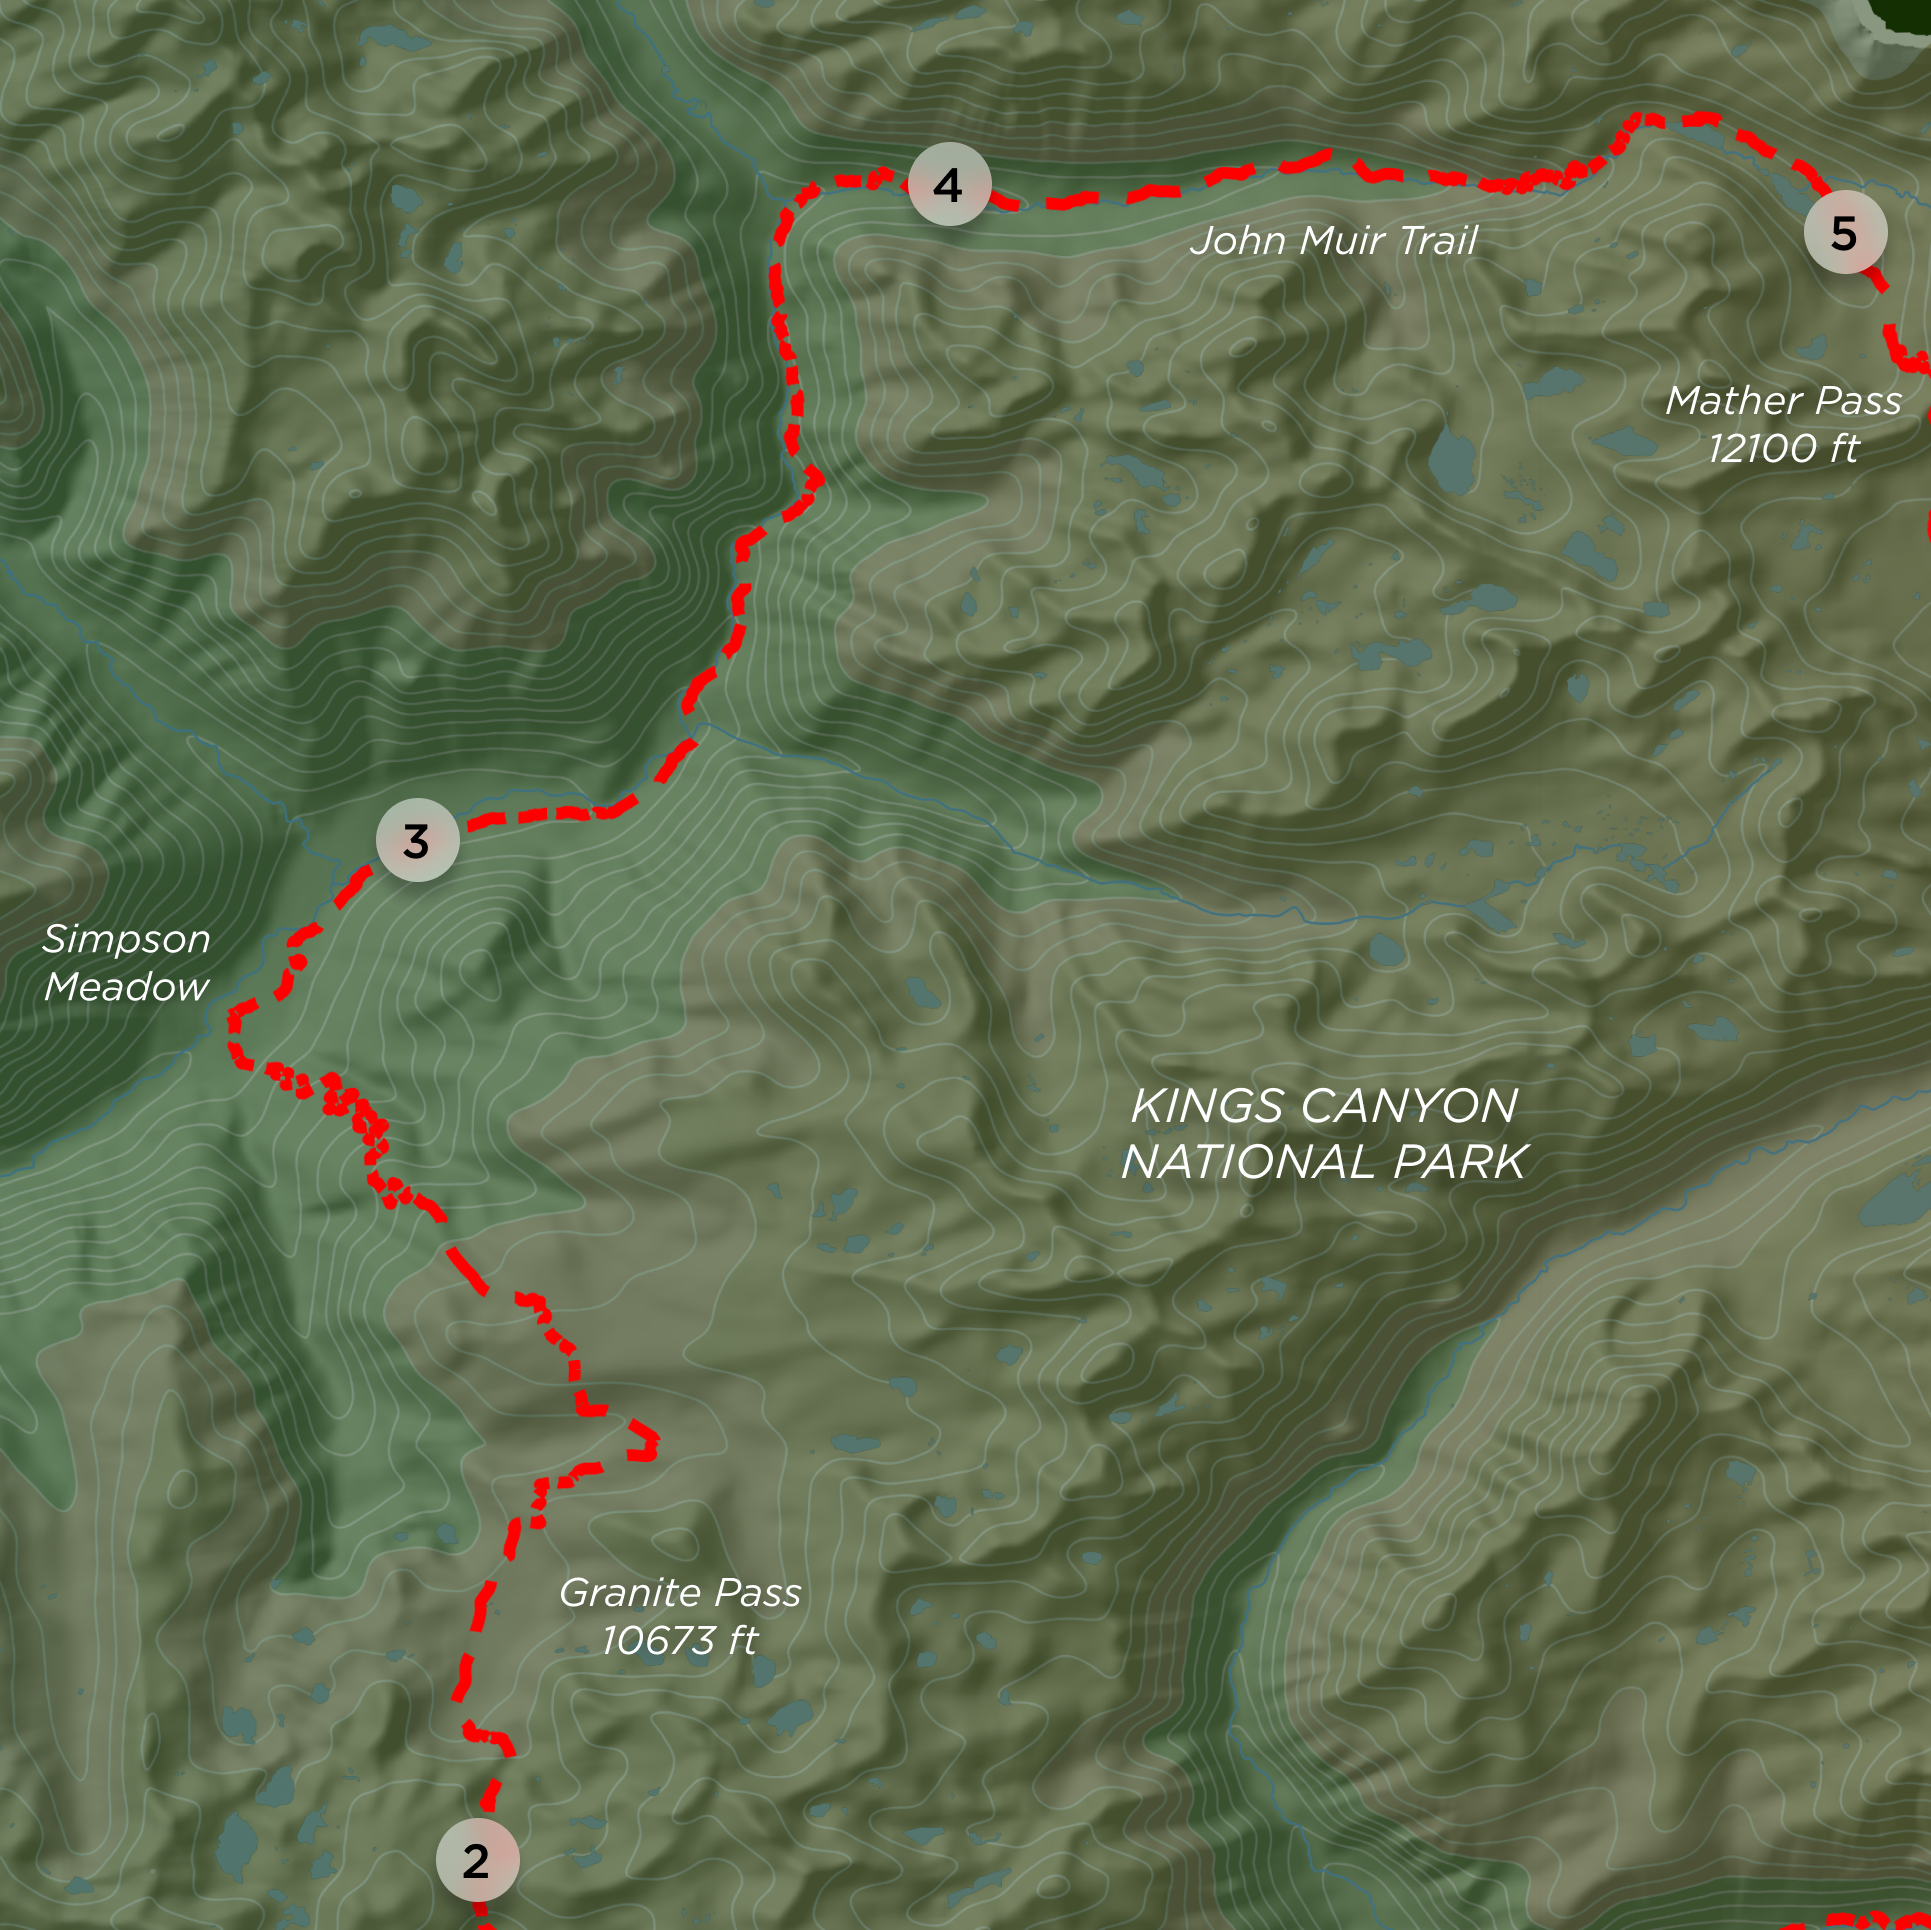
Big Seki Loop Poster
Poster visualizing a backpacking trip on the Big Seki Loop, Kings Canyon National Park.
Linear Regression / Data Analysis
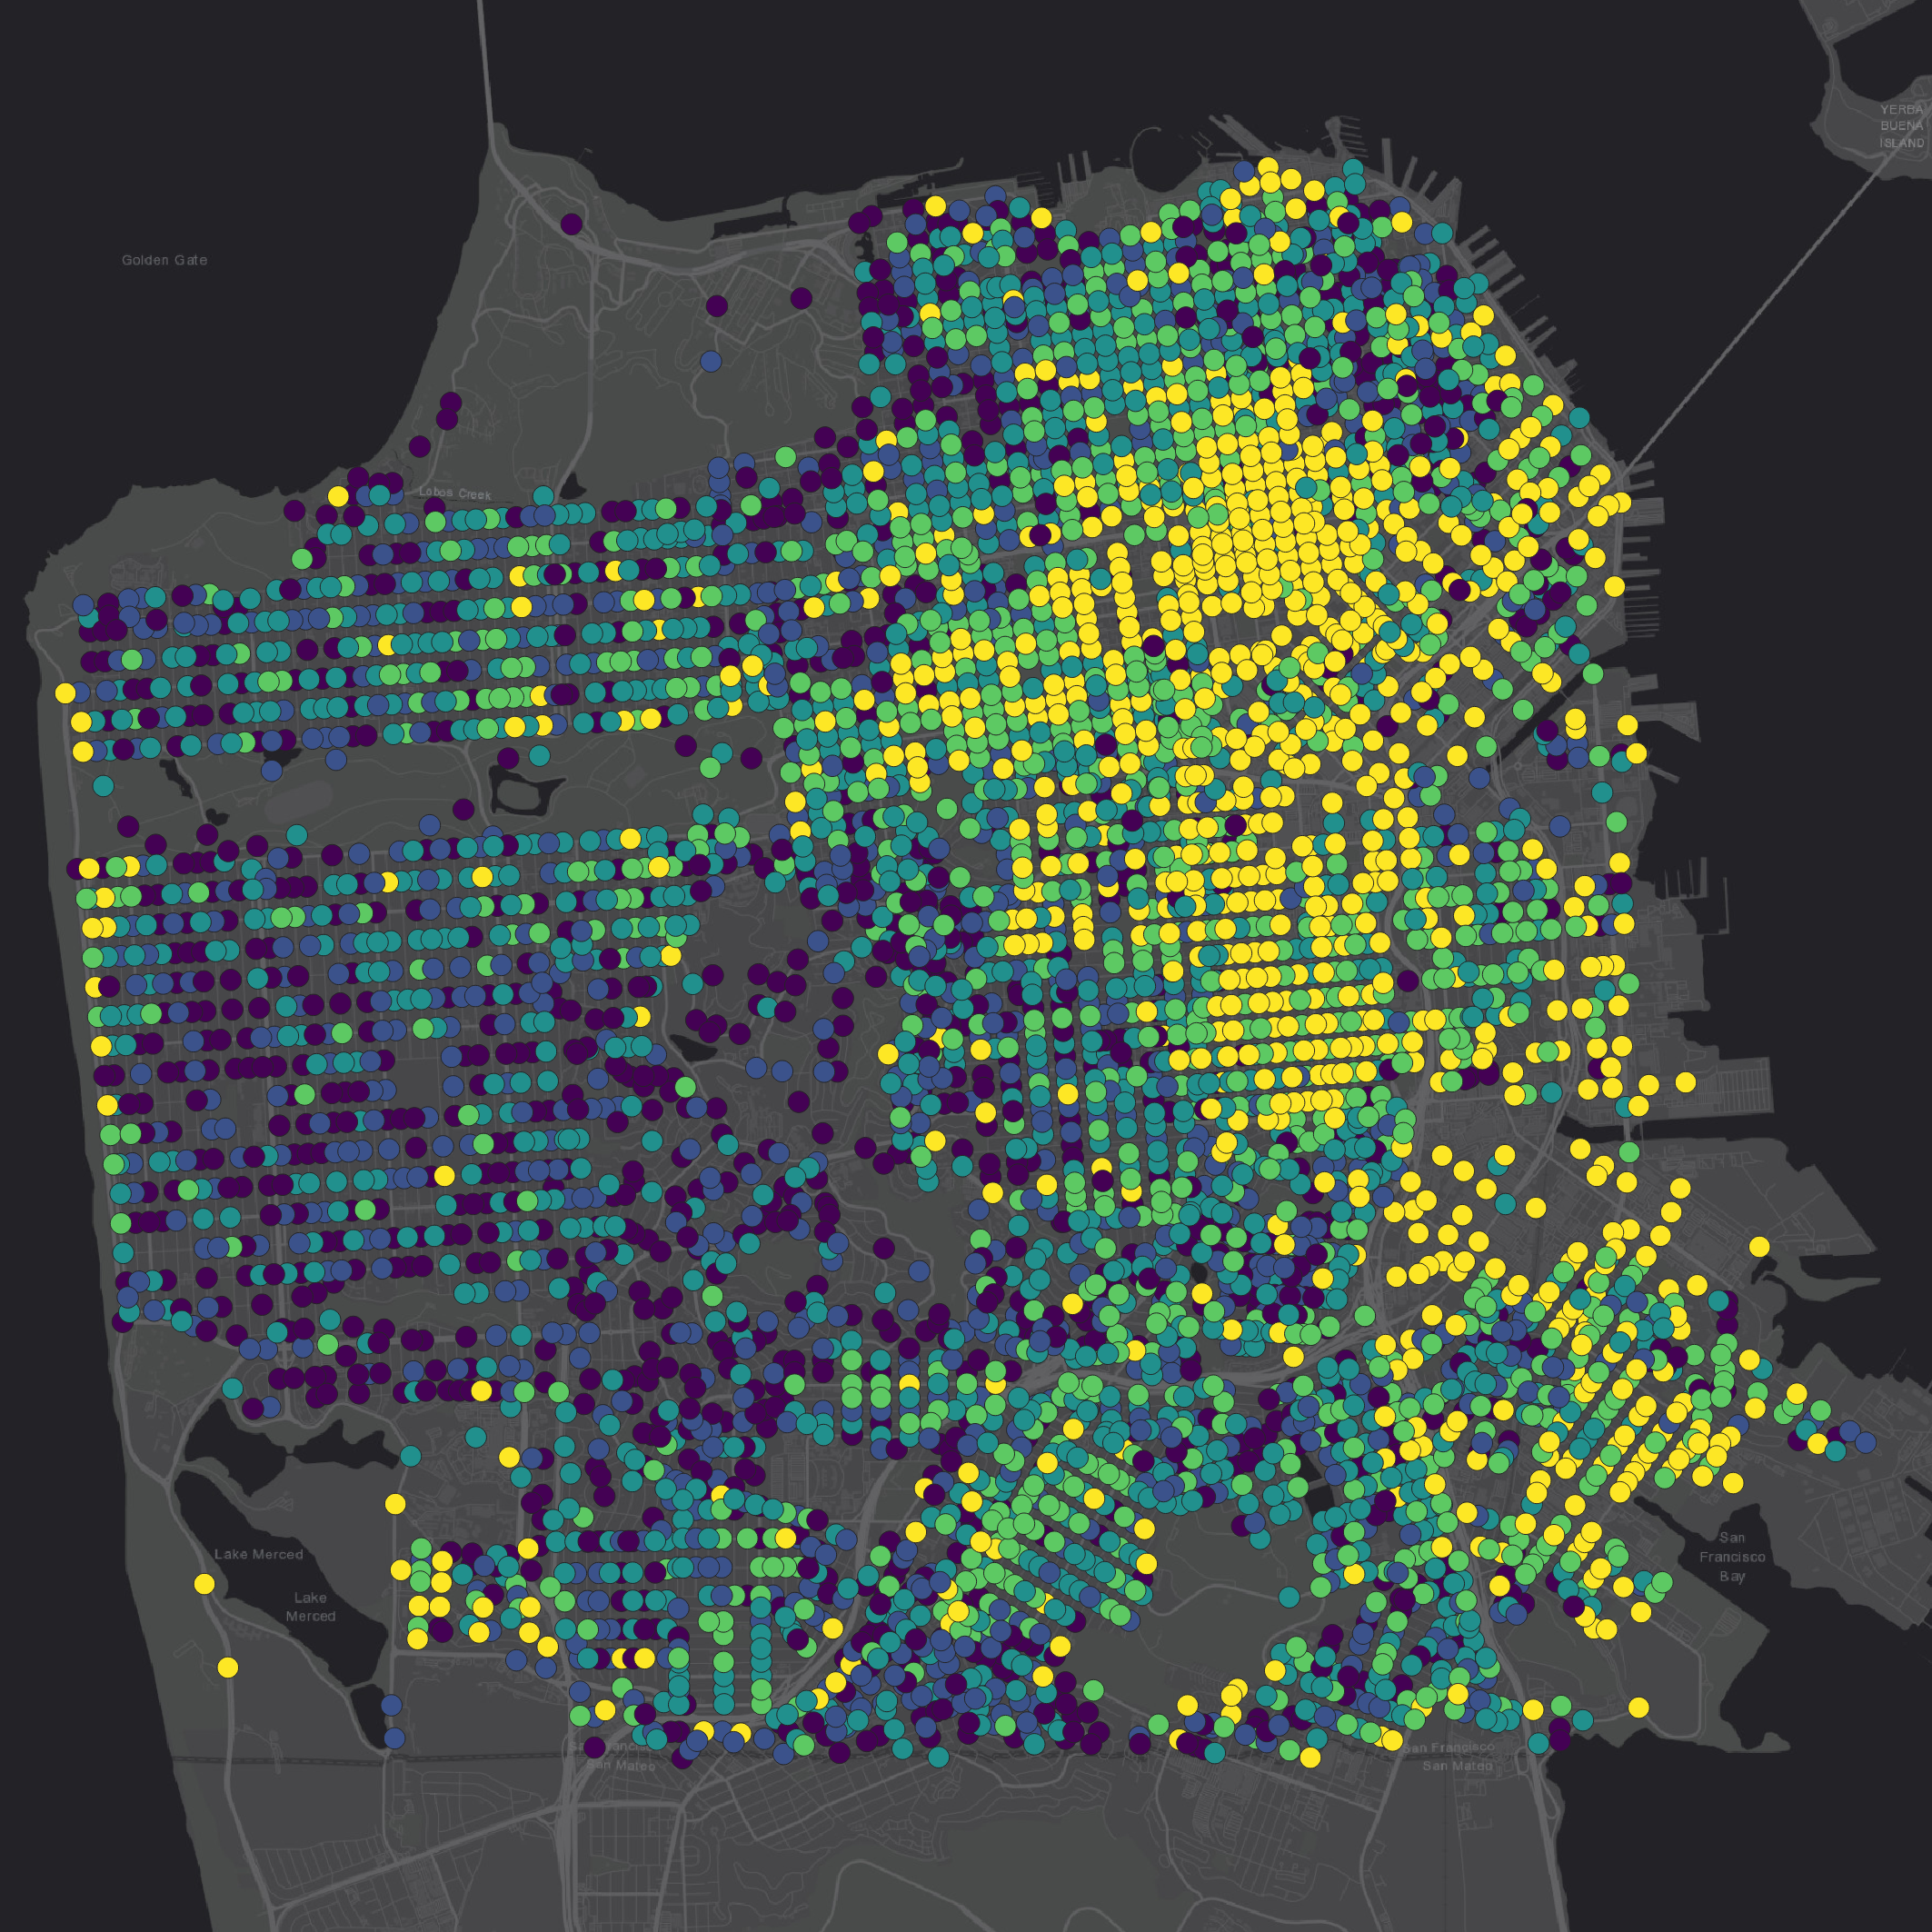
Regression Analysis of Crime and Topography in San Francisco
Does topography have an effect on the likelihood of car break-ins? Using data from San Francisco, CA.

Linear Regression / R Shiny
DataKind DeepDive Volunteering
Volunteer work during DataKind's December DataDive event for Benefits Data Trust.
Spatial Analysis / GIS
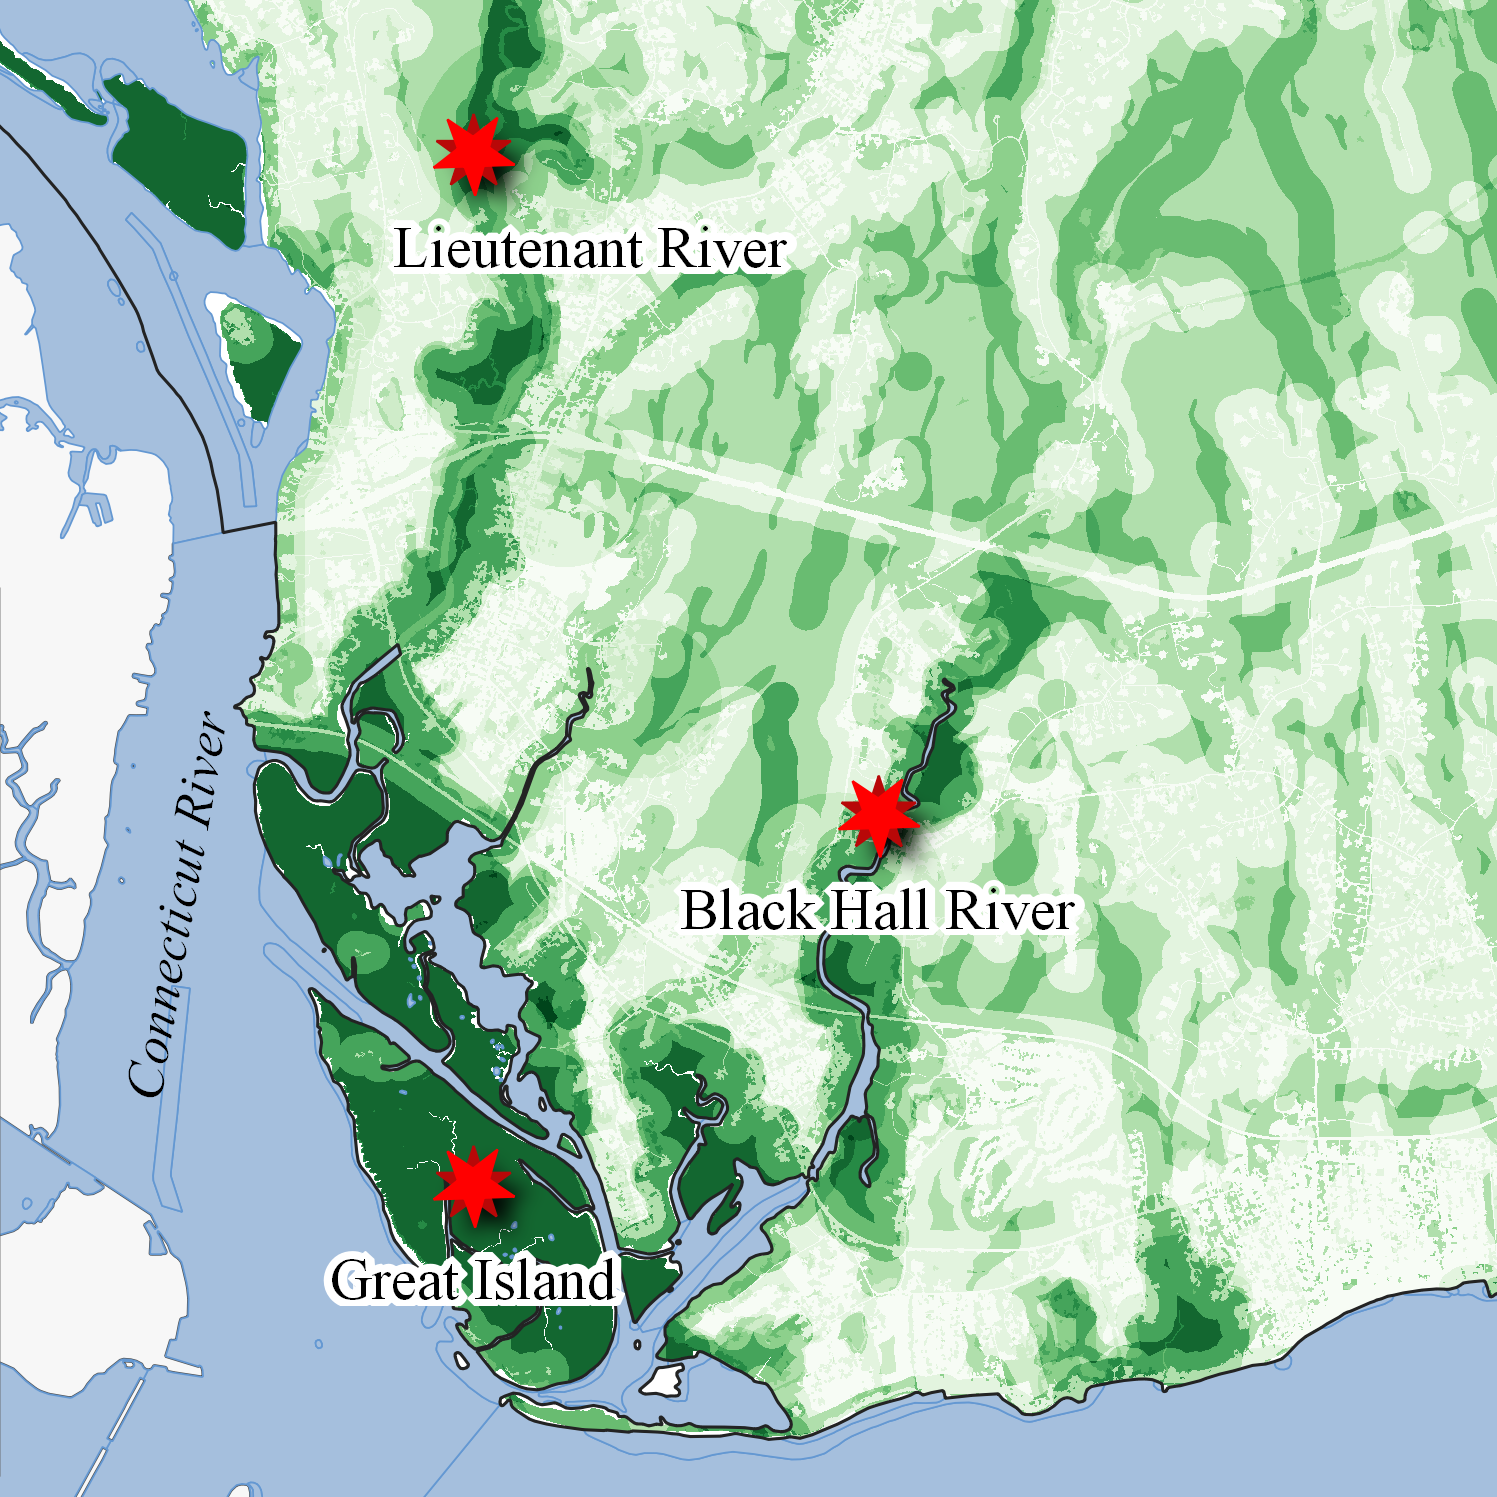
GIS Overlay Analysis for the Old Lyme Land Trust
Identifying properties with high natural resource values to assist with conservation acquisition targets.
Spatial Analysis / Remote Sensing
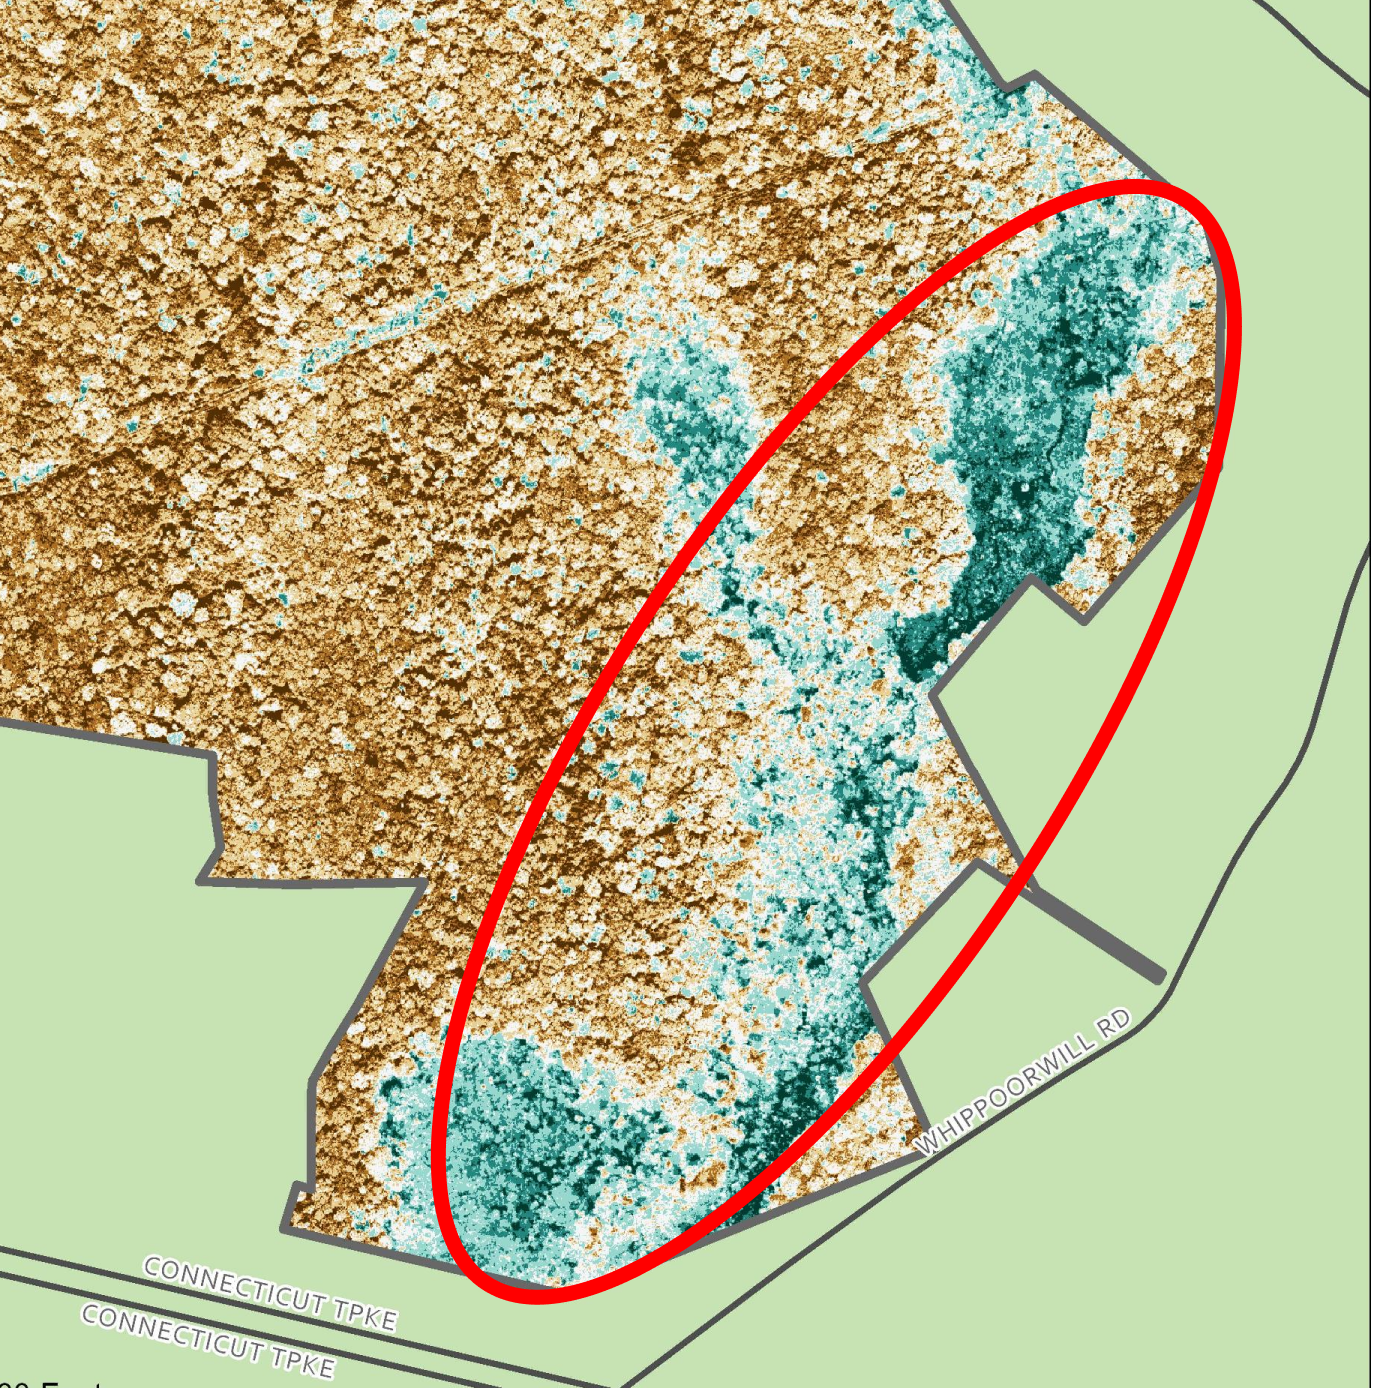
Visualizing Flooding Using NDWI
ArcGIS Story Map visualizing the extent of flooding as a result of beaver activity.

Data Analysis / Data Visualization
Analysis of 2020 Osprey Nation Data
Once facing extinction, the Connecticut Osprey population has made a substantial comeback. This blog analyzes the 2020 Osprey Nation Report by the Connecticut Audobon Society.