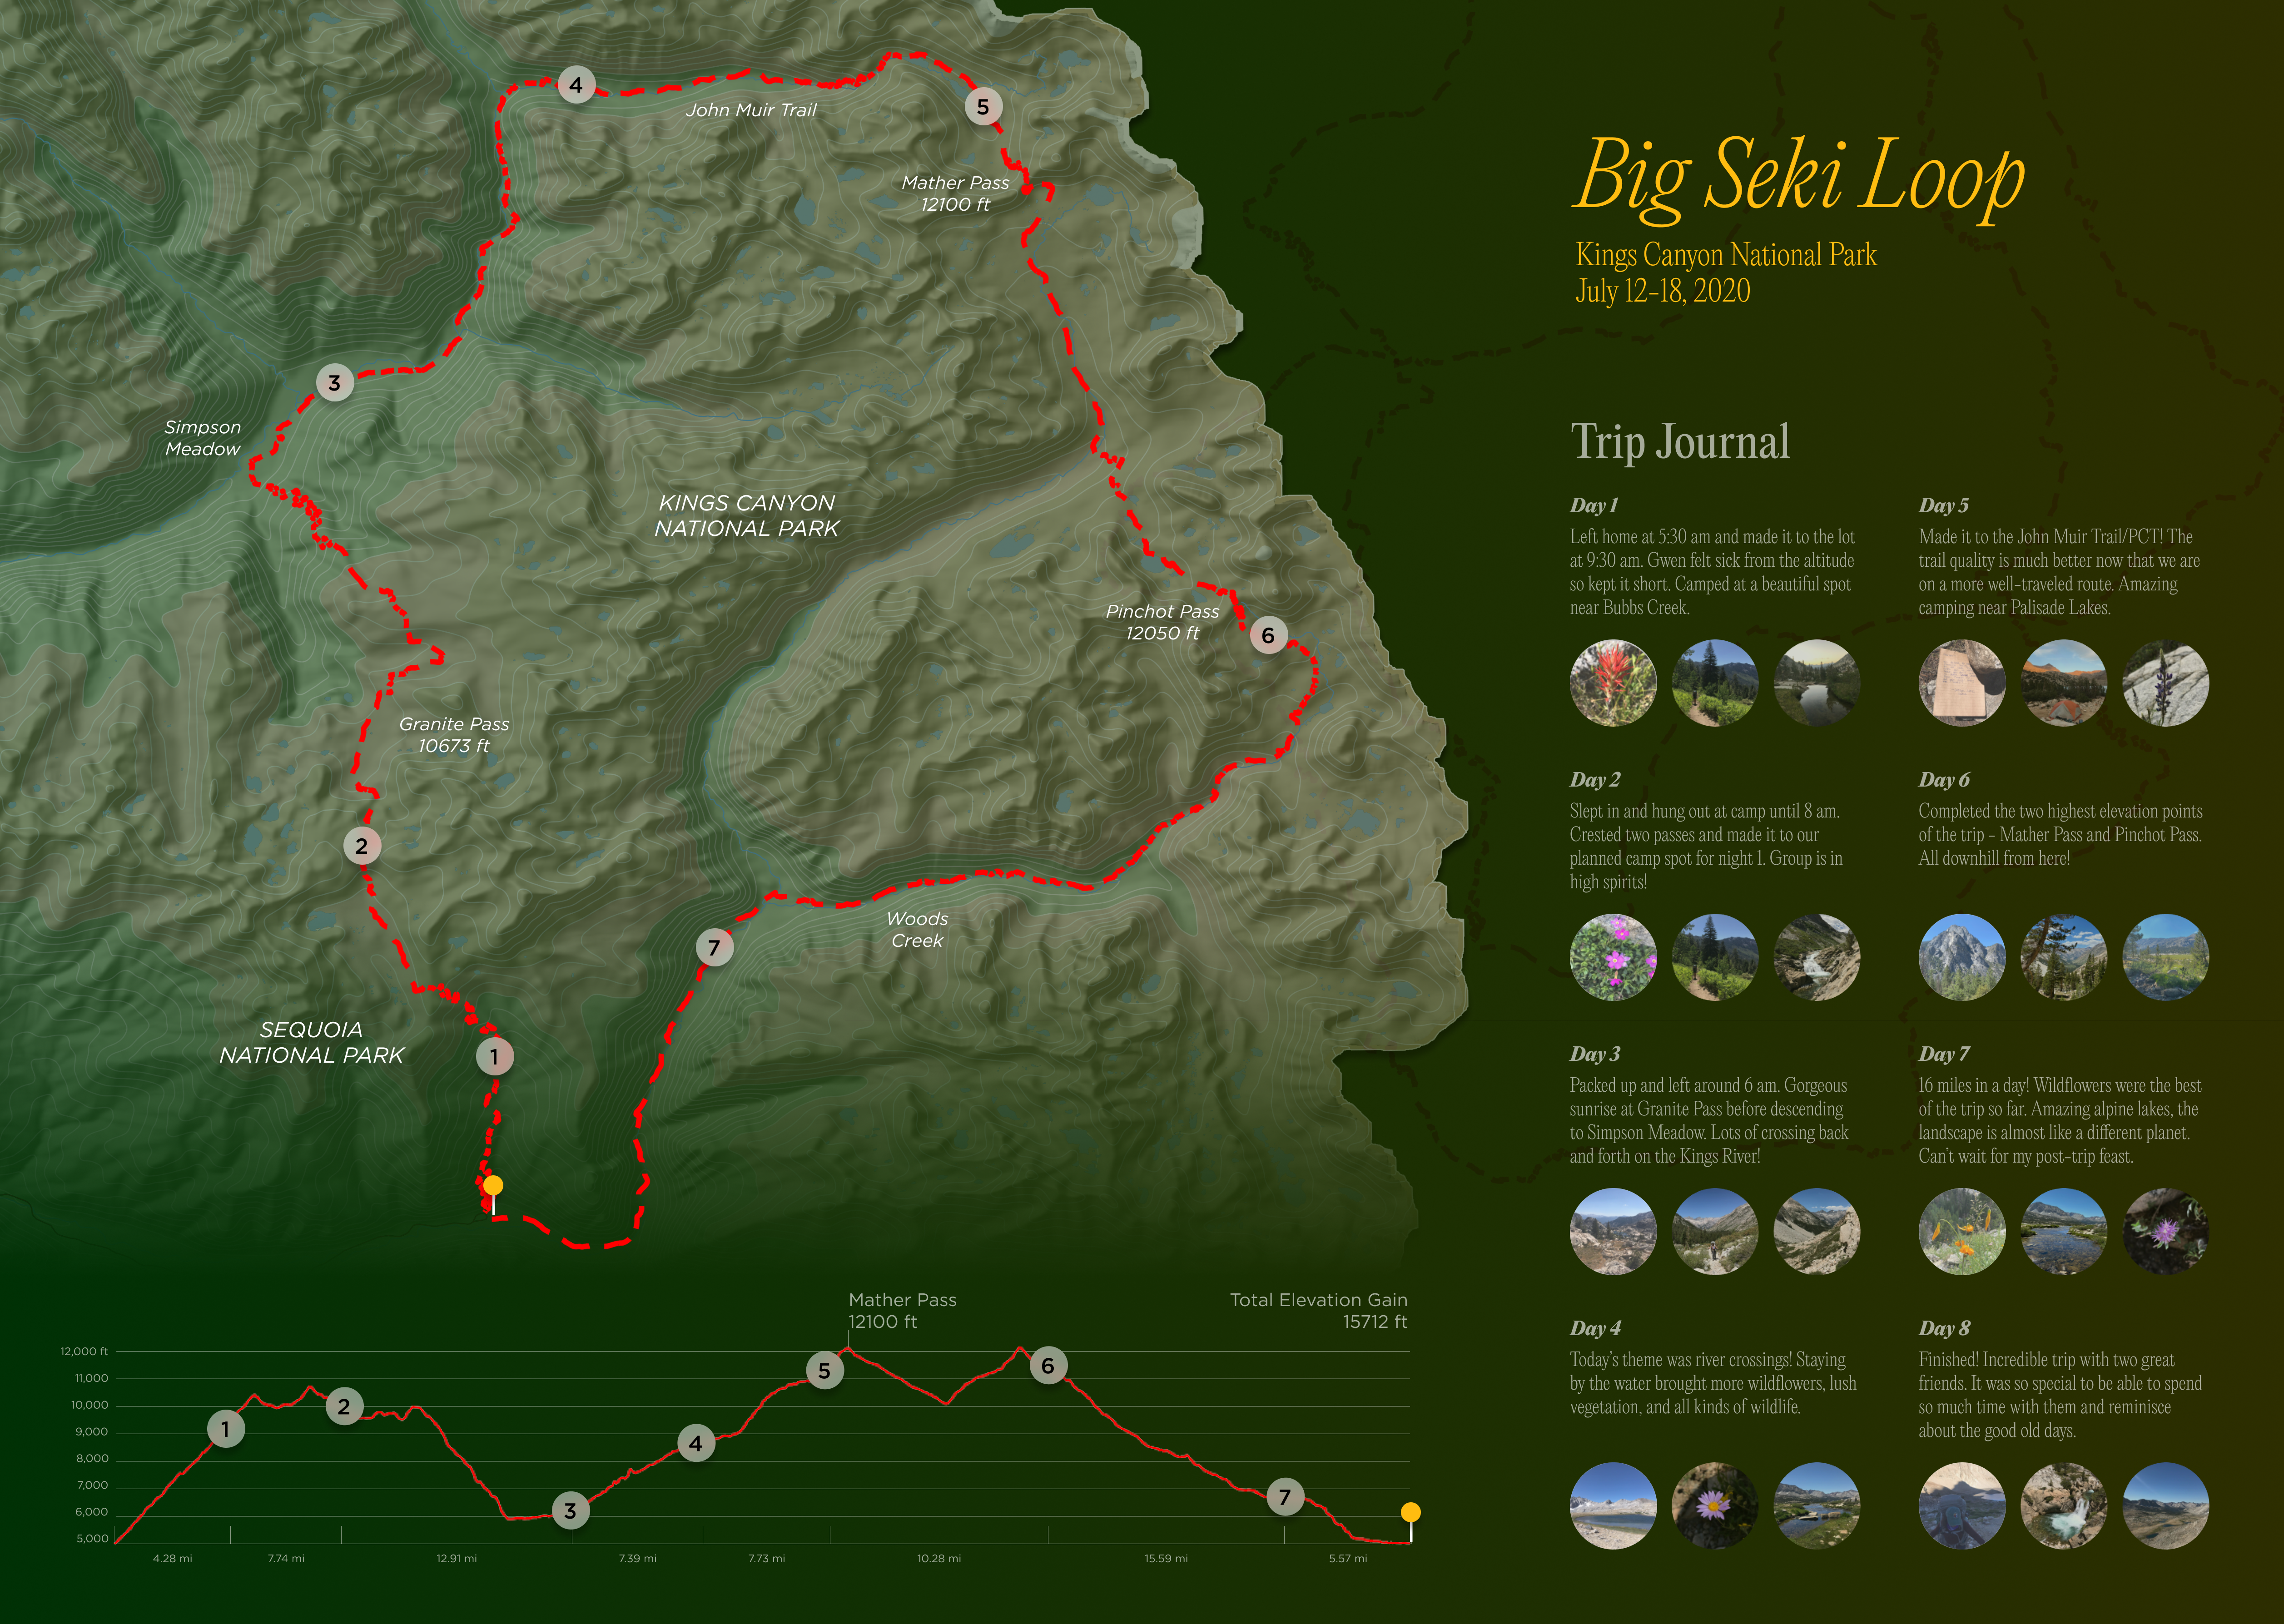
Big Seki Loop
Background
As the final project for EDS240 (Data Visualization) in my Master of Environmental Data Science degree, we were tasked with creating a visualization that told a story. For my project, I chose to create a graphic that would capture the personal memories and details of a backpacking trip that someone close to me completed in June of 2020.
Skills
R (RStudio)
ArcGIS Pro
Figma
Timeline
January - March 2022

Click here for the full-sized image
The map was created in ArcGIS Pro using a variety of data sources, including an SRTM Digital Elevation Model and National Park Service trails, boundaries, and water bodies. The elevation line chart was created using a GPX file downloaded from CalTopo that was then processed and visualized in R. Lastly, the vast majority of the graphic design work was completed in Figma - including the trip journal, chart axes, and many finishing touches to the map (labels, linear gradients, masks, and more). I am extremely happy with the finished product!